Glossary
Logout
©Copyright Arcturus 2022, All Rights Reserved.
7
Terms & Conditions
|
|
|
|
Security & Privacy
Contact
ANSOFF MATRIX - RISK ANALYSIS
|Introduction
Ansoff Matrix Analysis - Easily and accurately produce a visual representation of a traditional marketing matrix progression of risk in 2 dimensions representing a level of 'Product' and 'Market' Familiarity. The resultant position represents the degree of commercial risk the product/service is putting on the company. As such, there is a direct relationship with product forecasting.
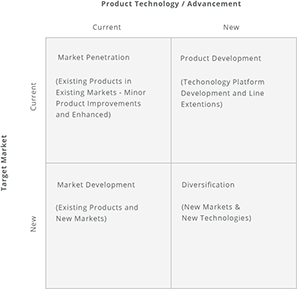
The model as understood, first developed by H. Igor Ansoff was a mathematician with an expert insight into business management. The Ansoff Matrix has four alternatives of marketing strategies; Market Penetration, Product Development, Market Development, and Diversification.
However, as published in many marketing books the 'Ansoff' matrix since the original publication circ. 1960, it is often described in its simplistic form whereby it fundamentally leads managers to believe there is a Boolean flip between each quadrant. So when it comes to the strategic analysis, incorrect conclusions could be made quite easily. Furthermore, this interpretation promotes a black or white strategic approach, which may not be the case. This model follows a much more structured approach when it comes to the derived position on the matrix itself...
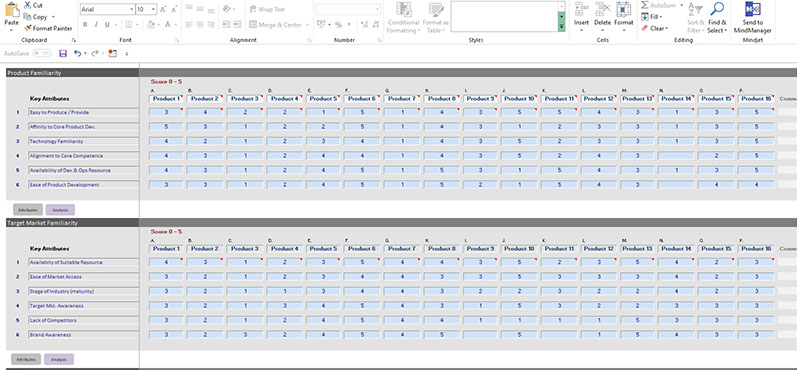
The Product and Market dimensions are broken down into 6 attributes (which can be modified if required) per category meaning overall we measure 12 attributions (6 + 6) which are then weighted in terms of their relative importance. Up to 16 Products / Services can be entered into this model, as such a comprehensive positioning map can be produced detailing the degree of commercial risk each product (within a portfolio) has on the company - Furthermore each plot can have a third dimension whereby the size of the plot itself can represent Revenue / Profit/ Volume. Overall this is an extremely useful strategic planning tool and offers a compelling presentation to support your strategic rationale.
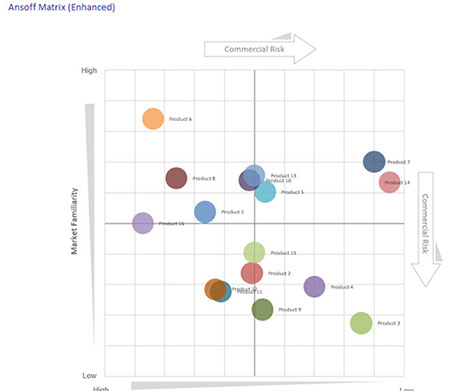
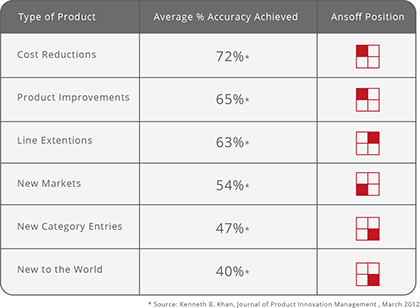
|Ansoff Position (Risk) Vs Average 'Forecast' Accuracy Achieved
|Who Should Attend
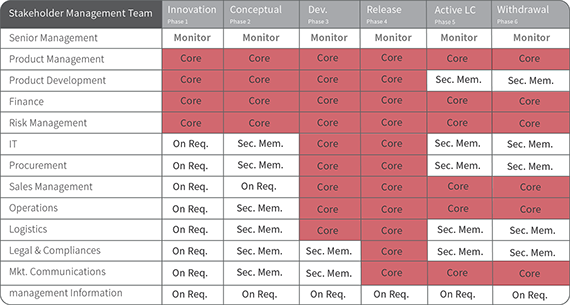
The following delegates / members of the Stakeholder Management Team (SMT) should attend the Ansoff Benchmarking workshop.
Key / Definition:
Monitor: Oversees the overall process, required to provide top level strategic objectives as required, performs a management role.
Core: Defines the ‘Core’ team headed (chaired) by the Product Manager required to attend the workshop in alignment with the ‘Product Phase’. Membership is mandatory.
Sec. Mem: Secondary Membership defines an ‘on‐standby’ membership requirement and will depend upon the subject area, phase alignment and the project status. Membership is managed by the Product Manager.
On Req: On Request membership defines a membership that is managed by the Product Manager.
|Related Procedures
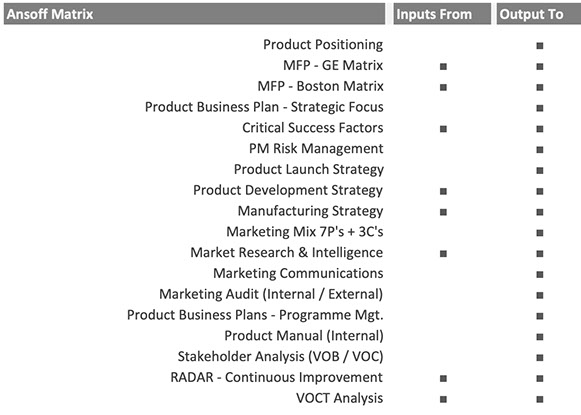
The following interrelationship maps indicate; suggested content from other models/processes which may have influence or an effect on the analysis of the title process. The left-hand column indicates information or impact from the named process and the left-hand column indicates on completion of the process/analysis it may have an influence or effect on the listed processes.
Note: A complete set (professional quality) of PMM interrelationship cards are available to purchase - please contact us for further details.
|Strategic Business Models, Workshop Tools & Professional Resources
The IPM practitioner series, is a definitive and integrated training programme for management professionals operating in the Product Management arena. So whether you’re the Managing Director, Product Director, Product Manager or a member of the Multidisciplinary Team we are confident that you will find this particular training series to be one of the best available and an invaluable asset to both you and your company.
PMM - Professional Support
Workshop Material
More
Interactive Business Models
More


